
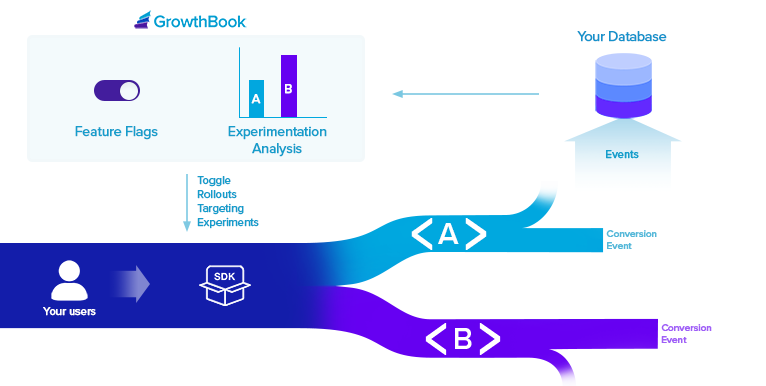
GrowthBook is a modular platform. You can use it for either Feature Flags, Experiment Analysis, or both. Feature Flags you create in the GrowthBook UI are published to our API as a JSON file. Pass this JSON into our SDKs and use the feature flags throughout your code. If a feature is running as part of an experiment, we’ll fire a tracking callback in the SDK so you can record that event in your data warehouse or analytics platform for later analysis. Experiment Analysis queries your data warehouse for raw experiment data and runs it through our stats engine to produce a report. No raw user-level events or PII are ever sent to GrowthBook. We only get back aggregate info instead (sums, sums of squares, etc.).Documentation Index
Fetch the complete documentation index at: https://growthbook-preview.mintlify.app/llms.txt
Use this file to discover all available pages before exploring further.
Feature Flags
Feature flags are a very powerful developer tool. They give you deep control over how and when new functionality is released to your users. GrowthBook supports 4 types of features:- Boolean (on/off)
- Number
- String
- JSON (with JSON Schema validation)
- Forced Value - Choose a subset of users based on targeting attributes and assign them all the same value
- Percentage Rollout - Use random sampling to roll out a new feature value to a percent of users
- Safe Rollout - Gradually ramp up traffic while monitoring guardrail metrics and automatically roll back if things go wrong
- Experiment - Run a controlled hypothesis test between 2 or more feature values
- Multi-Arm Bandit - Dynamically allocate traffic to different feature values based on performance
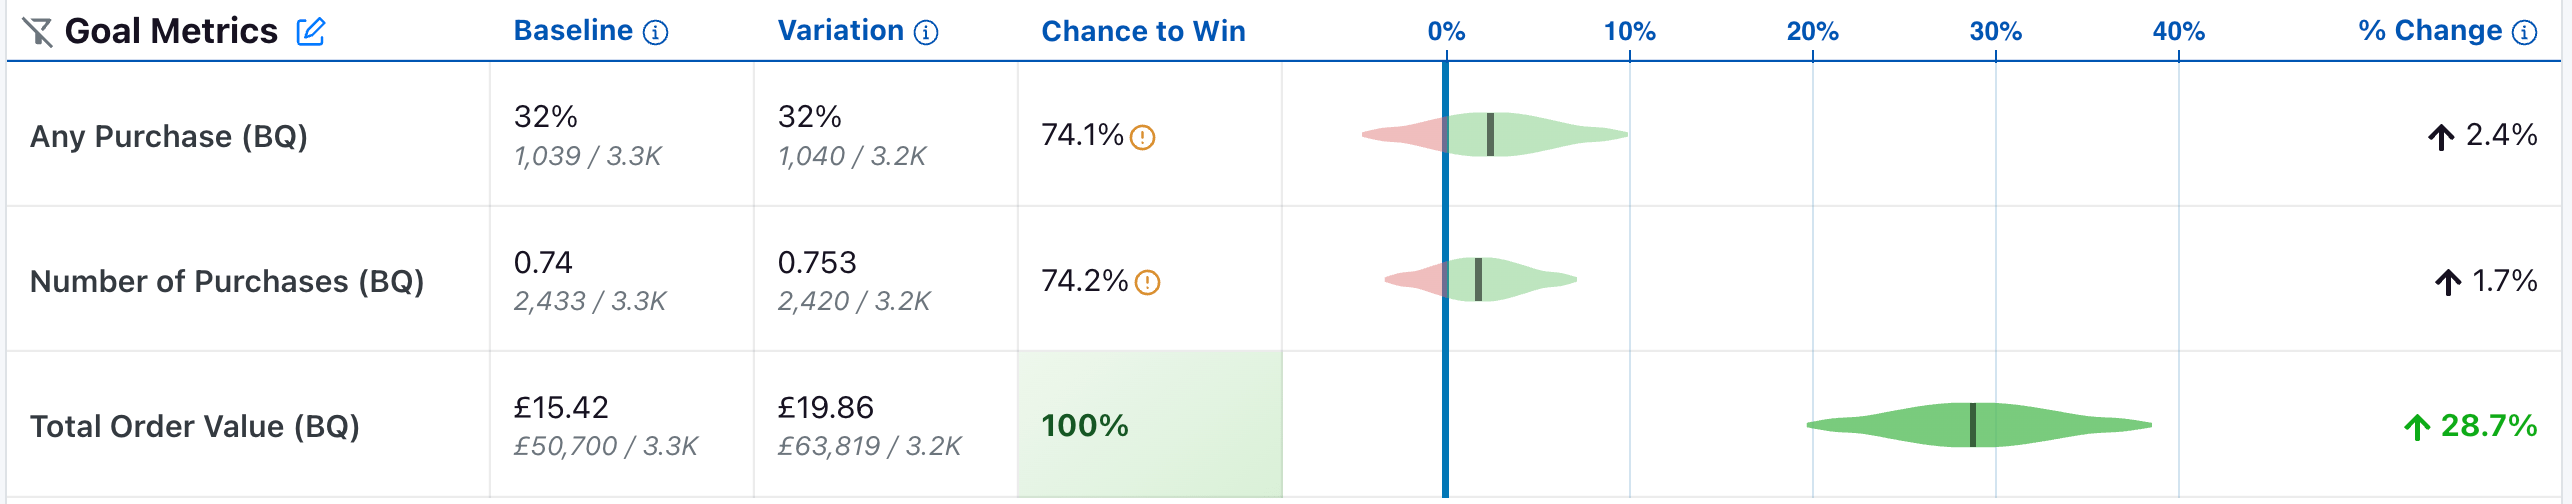
Experiment Analysis
GrowthBook needs to connect to your SQL Data Warehouse in order to query experiment results. GrowthBook is extremely flexible and can support almost any schema structure with a little bit of configuration.
- Proportion - A simple conversion rate (e.g.
signed up,purchased). - Mean - The average value across experiment units (e.g.
revenue,page views). Supports several different aggregation types: sum, count, max, and count distinct. - Ratio - A ratio of two values (e.g.
pages per session,revenue per order). - Quantile - The value at a specific percentile (e.g.
P99 Latency). - Retention - The percentage of experiment units who return after a delay (e.g.
day 7 retention). - Funnel - The percentage of experiment units who complete a series of steps (e.g.
signup funnel conversion). coming soon
- Frequentist or Bayesian - Choose the statistical framework that best fits your needs
- Sequential Testing - Always-valid p-values that allow you to safely peek at results as often as you like
- CUPED - Use pre-experiment data to reduce variance and improve sensitivity
- Sample Ratio Mismatch (SRM) - Automatically detect when experiment traffic is not being properly split between variations
- Multiple Comparison Corrections - Control for either false positive rate (Holm-Bonferroni) or false discovery rate (Benjamini-Hochberg)
- Different Baselines - Choose any variation as the baseline for comparison, not just control
- Custom Priors - For Bayesian stats, set custom prior distributions for each metric
- Power Calculator - Estimate the required runtime based on historical data before launching your experiment
- Difference Types - View metric differences as either relative lift, absolute lift, or scaled impact