
Cluster experiments are crucial when you need to randomize at a group level but analyze at an individual level. For example:Documentation Index
Fetch the complete documentation index at: https://growthbook-preview.mintlify.app/llms.txt
Use this file to discover all available pages before exploring further.
- A B2B software company might want to randomize at the business level so that everyone at the company gets the same experience, but analyze individual user behavior to measure impact.
- An education technology company might randomize at the school district level due to geographic constraints, but analyze outcomes at the student level.

How to run a Cluster Experiment
Running a cluster experiment at the organization level while analyzing at the user level is possible in GrowthBook using Fact Tables and the robust statistics engine. Here’s how:0. Prerequisites
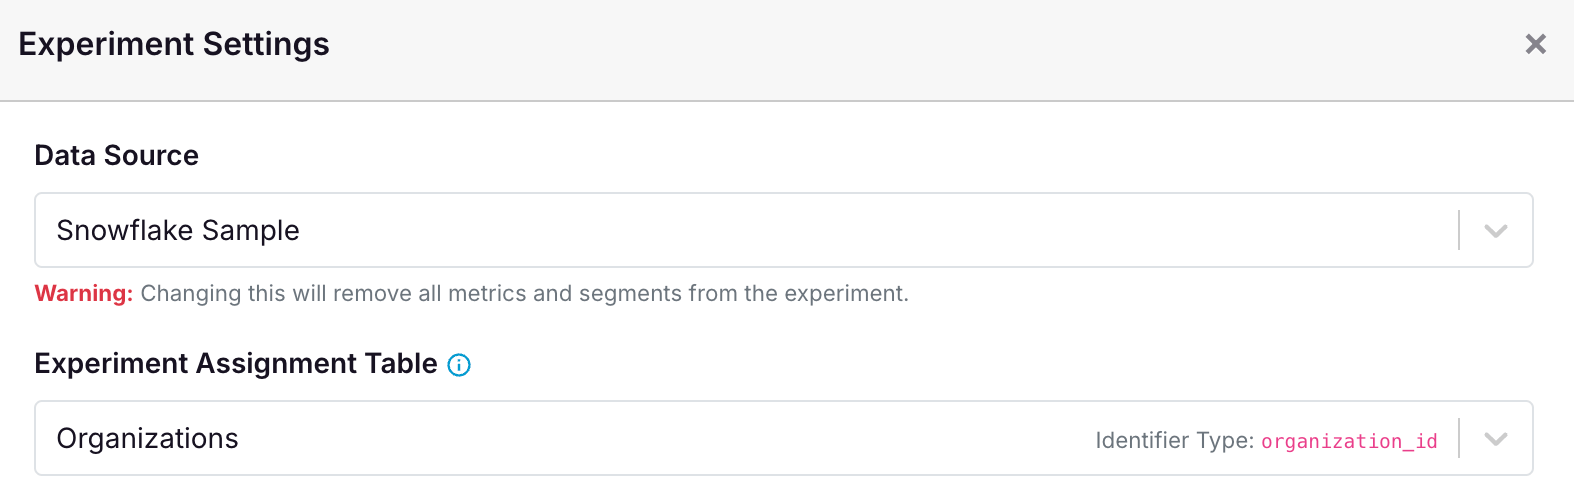
Before setting up your cluster experiment, ensure you have the following:organization_idmust be set up as an Identifier Type on your Data Source page.- If GrowthBook is handling randomization, create an Attribute
organization_id.
1. Set up a Fact Table with both identifier types
You need a version of your user-level metrics that has the distinct count of users as a custom denominator. To do this, create a Fact Table that has bothorganization_id and user_id as columns,
along with whatever other columns you need to create your metrics of interest. You can also use multiple fact tables with this
configuration if you prefer.
There must be a one-to-many relationship between
organization_id and user_id. Avoid users belonging to multiple organizations, as this can introduce bias.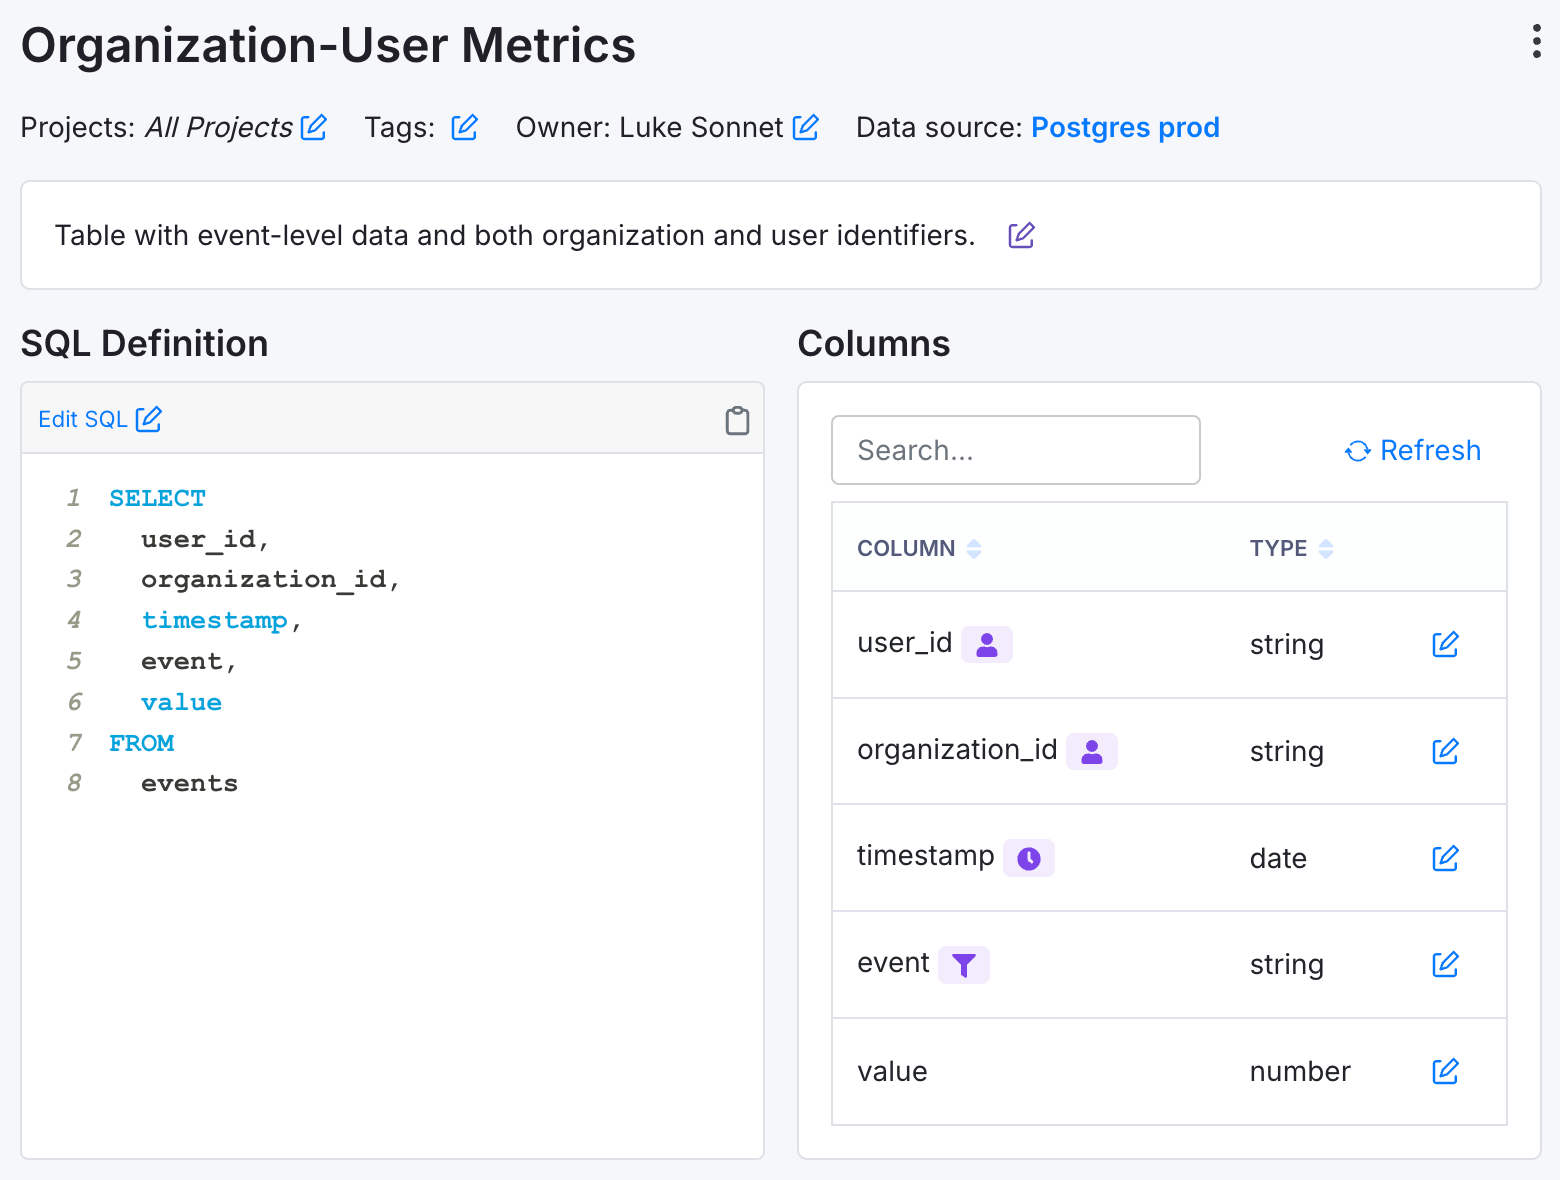
user_idandorganization_ididentifiers.- An
eventcolumn that represents the event you are interested in measuring. - A numeric
valuecolumn that represents the value of the event.
Every
user_id exposed to the experiment should have at least 1 event logged to ensure inclusion in the metric denominator.2. Set up your Metrics
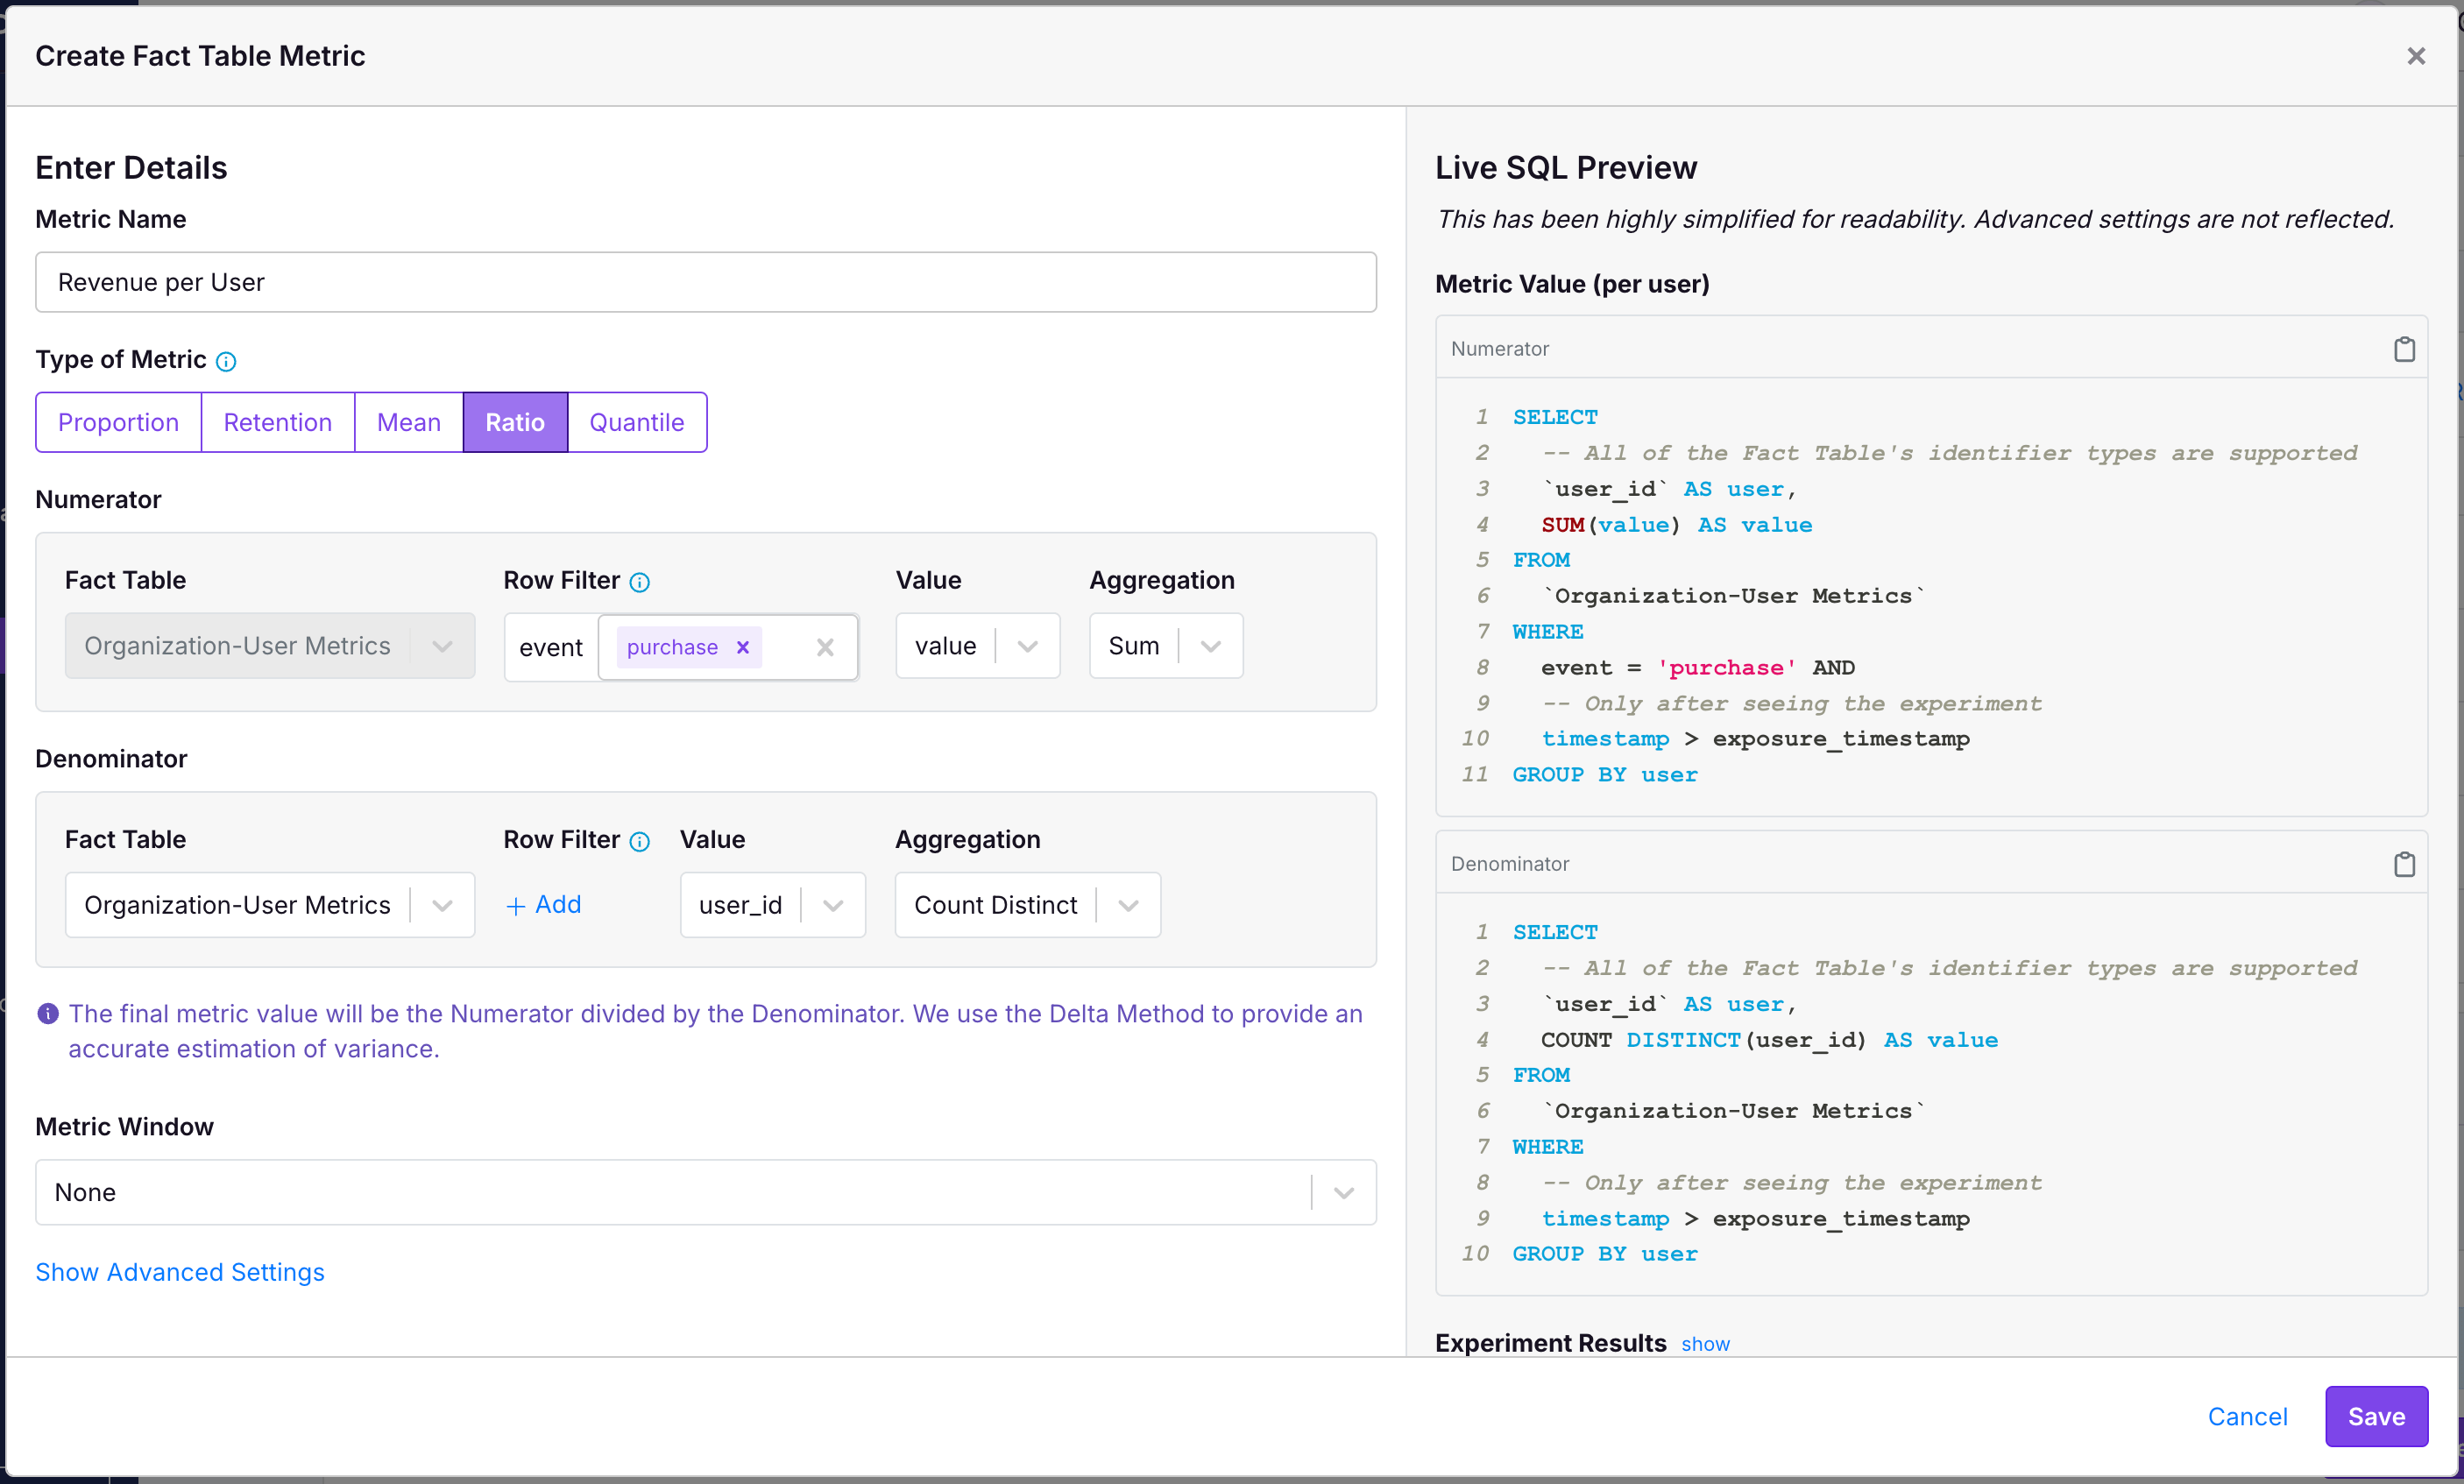
Using this Fact Table, create Ratio Metrics that all have theCOUNT DISTINCT of user_id as their denominators.
In the following example, we have a User Revenue metric:
- The numerator is sum the value of all purchases across all users.
- The denominator is the
COUNT DISTINCTnumber ofuser_id.
- The numerator is a
COUNT DISTINCTnumber ofuser_idthat did some particular event. - The denominator is a
COUNT DISTINCTofuser_idthat logged any event.
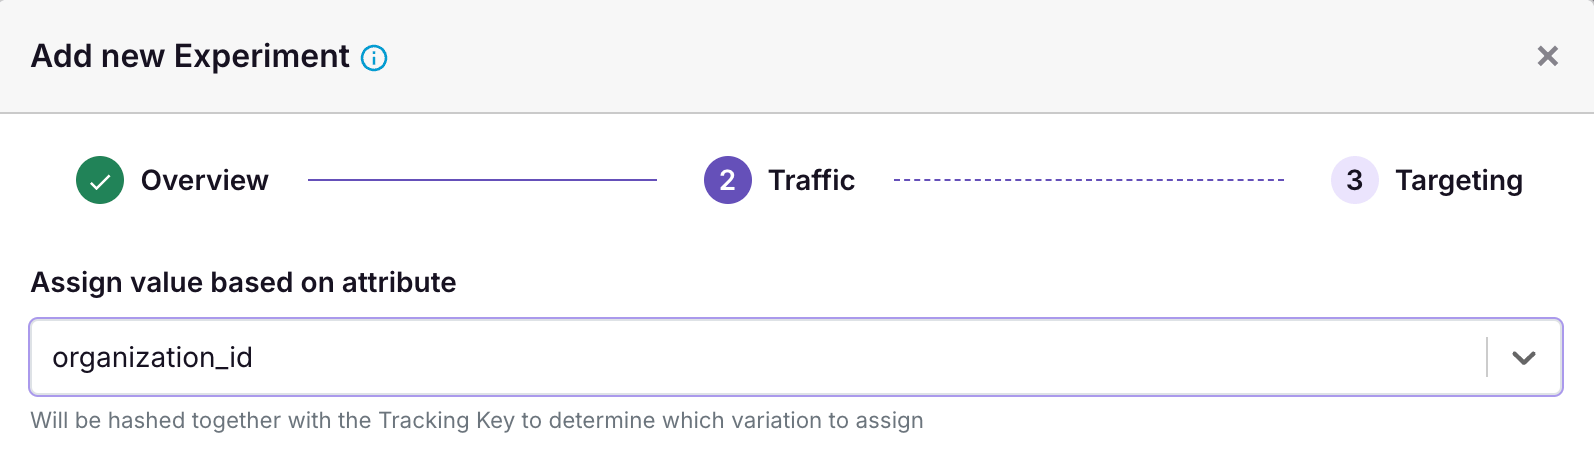
3. Create your Experiment at the Organization level
All that is left to do is create your experiment where you randomize at theorganization_id level. The following screenshot shows an example of that.
organization_id mapping. If you do not have one, you may need to set it up in your Data Source to ensure that GrowthBook knows the mapping between organization_id and experiment and variation assignments.