

Fact Tables in GrowthBook are a powerful way to quickly build out a library of metrics. Below are some common types of tables in your data warehouse and how to map them to Fact Tables with example SQL and metric definitions. The Add to GrowthBook buttons will open GrowthBook and let you customize the metric before adding it to your account.Documentation Index
Fetch the complete documentation index at: https://growthbook-preview.mintlify.app/llms.txt
Use this file to discover all available pages before exploring further.
Raw Events Table
The most common form of analytics data is a raw event stream. Every time a user does something, you append a new row to an events table in your warehouse. All types of events from all users are intermixed in this one table. Fact Tables in GrowthBook work really well with raw events. When defining your Fact Table in GrowthBook, there are 4 important types of columns you will want to select:- Timestamp - When the event occurred
- Ids - Who triggered the event (user id, device id, etc.)
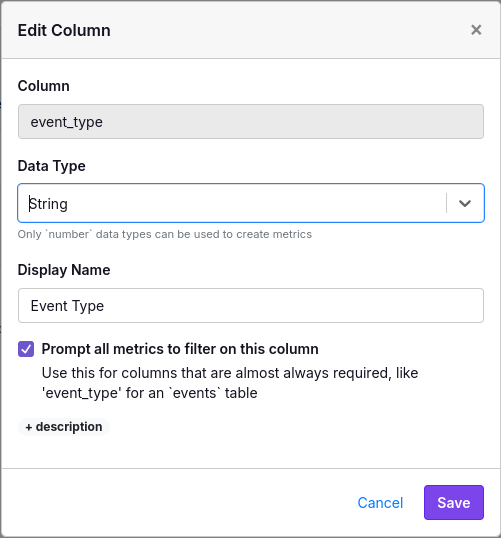
- Event Type - What action was performed (page view, start checkout, add friend, etc.)
- Context - Any helpful user or app context (geo-location, current url, account plan, etc.)
Example SQL: Google Analytics 4 (GA4) Events
When you configure Google Analytics 4 to sync events into BigQuery, they get written to a raw events table (actually multiple tables partitioned by day, but that’s more of an implementation detail) Here’s example SQL for a fact table. Comments added to highlight the 5 column types aboveExample Metrics
Percent of users who submit a form
- Select
Proportionas the metric type - Choose
form_submitas the event type
Percent of users who visit the checkout page
- Select
Proportionas the metric type - Choose
page_viewas the event type - Add a “Row Filter” and select
page_path = '/checkout'
Page Views per User
- Select
Meanas the metric type - Choose
page_viewas the event type - Select
Count of Rowsas the value
Unique Page Views per User
- Select
Meanas the metric type - Choose
page_viewas the event type - Select
event_valueas the column - Select
COUNT DISTINCTas the aggregation
Active Days per User
- Select
Meanas the metric type - Choose
Distinct Datesas the column
Checkout completion rate
- Select
Ratioas the metric type - For the numerator (confirmation)
- Choose
page_viewas the event type - Add a Row Filter for
page_path = '/confirmation' - Select
Unique Usersas the value
- Choose
- For the denominator (checkout)
- Choose
page_viewas the event_type - Add a Row Filter for
page_path = '/checkout' - Select
Unique Usersas the value
- Choose
Modeled Tables
Another common way to store data in a warehouse is with modelling. This usually involves a tool likedbt that transforms raw event logs into multiple well-structured tables. There are also some event tracking tools like Segment which do this automatically.
For our purposes, we are only considering modeled tables that do not include a GROUP BY in the data pipeline - in other words, the rows are still at the raw event-level. Check out the Pre-aggregated Tables section below if this is not the case.
In GrowthBook, we recommend creating a separate Fact Table for each one of your modeled tables. At the very least, you will need a Timestamp and IDs of who performed the action. Any additional columns you add are optional and can be used to build out metrics.
Example SQL: E-Commerce Orders Table
num_items, grand_total, and shipping_type. These columns will help us build out a rich set of metrics. This is one of the big benefits over using a raw events table directly where the columns you select need to be more generic and work across a wide range of different events.
Similar to raw event tables, you can optionally add a WHERE clause on dates for faster/cheaper queries:
Example Metrics
Users who Purchased
- Select
Proportionas the metric type and that’s it!
Users who Purchased Multiple Times
- Select
Proportionas the metric type - Add a “User Filter” based on
Count of Rows - Enter
>= 2as the User Filter value
Orders per User
- Select
Meanas the metric type - Select
Count of Rowsas the metric value
Revenue per User
- Select
Meanas the metric type - Select
SUM(grand_total)as the metric value
Average Items per Order
- Select
Ratioas the metric type - For the numerator, select
SUM(num_items) - For the denominator, select
Count of Rows
Users Without Orders
- Select
Proportionas the metric type - Add a “User Filter” for
Count of Rows = 0 - Under Advanced Settings -> Display Settings, change the goal to
Decrease the Metric Value
Percent of Orders with Free Shipping
- Select
Ratioas the metric type - For the numerator, add a row filter for
shipping_type = 'free' - Select
Count of Rowsfor both the numerator and denominator
Pre-Aggregated Tables
Pre-aggregated tables include a GROUP BY in the data pipeline to compress raw event-level data down to fewer rows. This is usually done when querying raw data directly is prohibitively expensive. GrowthBook supports pre-aggregated tables as long as they satisfy two requirements:- Must be grouped by both user and date
- Pre-aggregated columns can only be basic sums or counts. No averages, percentiles, count distinct, or complex derived formulas that break statistical assumptions.
Example SQL: Social Media Interactions (User/Date Rollup)
If you have a social media app, the number of raw interactions might be huge. A user/date rollup table can drastically reduce the size of the data set. Here is an example Fact Table SQL definition in GrowthBook that references a user/date rollup table.timestamp column isn’t very accurate. All events for a day are recorded as happening at the beginning of the day (usually at midnight). We only consider Fact Table rows with a timestamp after a user first enters an experiment. That basically means a user’s first day of data will be excluded from the analysis. This is a big deal because those first few hours after entering a test are often the most important.
We can fix this by incrementing all timestamps by 1 day in our Fact Table definition (specific SQL varies by db engine):
Example Metrics
Percent of Users with High Engagement
- Select
Proportionas the metric type - Add a “User Filter” and select
SUM(interactions)as the value to filter on - Add some threshold as the User Filter value. Something like
> 100
Interactions per User
- Select
Meanas the metric type - Select
SUM(interactions)as the value
P90 Likes per User
- Select
Quantileas the metric type - Check the “Group by user” box
- Select
SUM(likes)as the per-user value - Select
P90as the quantile level
Comment-to-Like Ratio
- Select
Ratioas the metric type - Select
SUM(comments)as the numerator value - Select
SUM(likes)as the denominator value