

If you are new to A/B testing, you may find a lot of new terminology. The goal of this section is to help you understand the basics of A/B testing.Documentation Index
Fetch the complete documentation index at: https://growthbook-preview.mintlify.app/llms.txt
Use this file to discover all available pages before exploring further.
Glossary - Common Experimentation Terms
Control (or Baseline)
The existing version of the product that you are trying to improve upon.Variation (or Treatment)
A new version of the page that you are testing against the Control.Hypothesis
Formal way to describe what you are changing and what you think it will do.Statistical Significance
An indicator that the difference in performance between the control and treatment groups is unlikely to have occurred by chance.Confidence level
The level of certainty we want before the result of a test is statistically significant. A common confidence level used in A/B testing is 95%.Sample size
The number of visitors or users who are included in the A/B test.Test duration
The length of time that the A/B test is run. This can vary depending on the sample size and the desired confidence level.Variance
The degree to which the results of an A/B test vary over time or across different segments of the user base.Anatomy of an A/B test
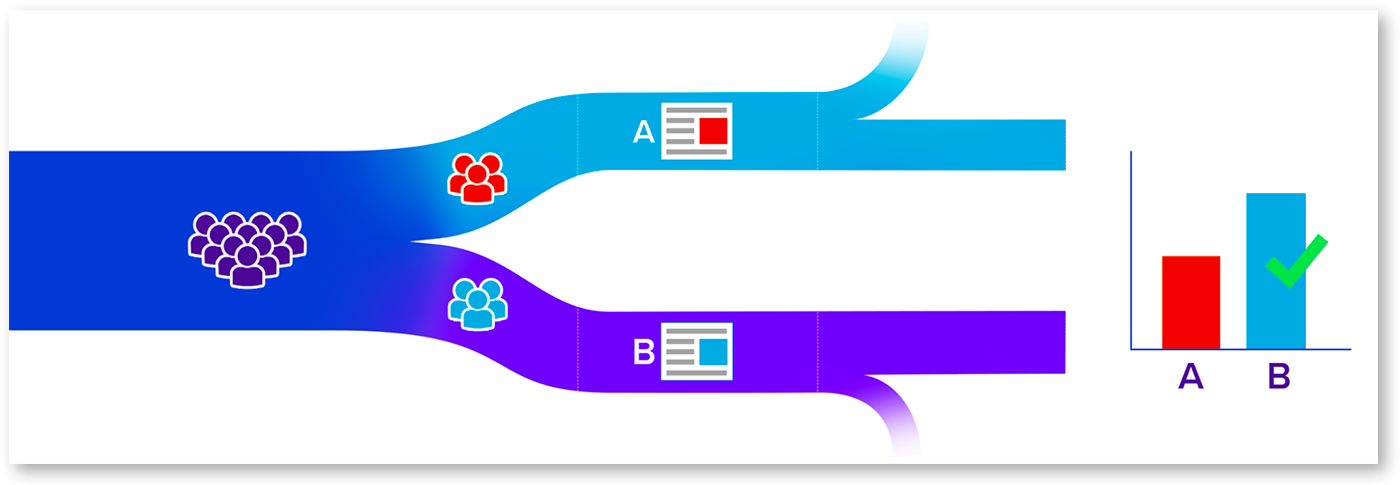
| Hypothesis Come up with an idea you want to test | Assignment Randomly split your audience into persistent groups | Variations Create and show different experiences to each group | Tracking Record events and behaviors of the two groups | Results Use statistics to determine if the differences in behavior are significant |
Hypothesis
Good A/B tests, and really any project, starts with a hypothesis about what you’re trying to do. A good hypothesis should be as simple, specific, and falsifiable as possible. A good A/B test hypothesis should be:- Specific: The hypothesis should clearly state what you want to test and what outcome you expect to see.
- Measurable: The hypothesis should include a metric or metrics that can be used to evaluate the outcome of the test.
- Relevant: The hypothesis should be relevant to your business goals and objectives.
- Clear: The hypothesis should be easy to understand and communicate to others.
- Simple: The fewer variables that are involved in the experiment, the more causality can be implied in the results.
- Falsifiable: The hypothesis should be something that can be tested using an A/B test to determine the validity of the hypothesis.
Audience and Assignments
Choose the audience for your experiment. To increase the detectable effect of your experiment, the audience you choose should be as close to the experiment as possible. For example, if you’re focusing on a new user registration form, you should select as your audience just unregistered users. If you were to include all users, you would have users who could not see the experiment, which would increase the noise and reduce the ability to detect an effect. Once you have selected your audience, you will randomize users to one variation or another.Variations
An A/B test can include as many variations as you like. Typically the A variation is the control variation. The variations can have as many changes as you like, but the more you change the less certain you can be what caused the change.Tracking
Tracking is the process of recording events and behaviors that your users do. In the context of AB testing, you want to track events that happen after exposure to the experiment, as these events will be used to determine if there is a change in performance due to being exposed to the experiment. AB testing systems either are “warehouse native” (like GrowthBook) as in they use your existing event trackers (like GA, Segment, Rudderstack, etc), or they require you to send event data to them.Results
With A/B testing we use statistics to determine if the effect we measure on a metric of interest is significantly different across variations. The results of an A/B test on a particular metric can have three possible outcomes: win, loss, or inconclusive. With GrowthBook we offer two different statistical approaches, Frequentist and Bayesian. By default, GrowthBook uses Bayesian statistics. Each method has their pros and cons, but both will provide you with evidence as to how each variation affected your metrics.Experimentation Basics
Typical success rates
A/B testing can be incredibly humbling—one quickly learns how often our intuition about what will be successful with our users is incorrect. Industry wide average success rates are only about 33%. ⅓ of the time our experiments are successful in improving the metrics we intended to improve, ⅓ of the time we have no effect, and ⅓ of the time we hurt those metrics. Furthermore, the more optimized your product is, the lower your success rates tend to be. But A/B testing is not only humbling, it can dramatically improve decision making. Rather than thinking we only win 33% of the time, the above statistics really show that A/B tests help us make a clearly right decision about 66% of the time. Of course, shipping a product that won (33% of the time) is a win, but so is not shipping a product that lost (another 33% of the time). Failing fast through experimentation is success in terms of loss avoidance, as you are not shipping products that are hurting your metrics of interest.Experiment power
With A/B testing, power analysis refers to whether a test can reliably detect an effect. Specifically, it is often written as the percent of the time a test would detect an effect of a given size with a given number of users. You can also think of the power of a test with respect to the sample size. For example: “How many times do I need to toss a coin to conclude it is rigged by a certain amount?”Minimal Detectable Effect (MDE)
Minimal Detectable Effect is the minimum difference in performance between the control and treatment groups that can be detected by the A/B test, given a certain statistical significance threshold and power. The MDE is an important consideration when designing an A/B test because if the expected effect size is smaller than the MDE, then the test may not be able to detect a significant difference between the groups, even if one exists. Therefore, it is useful to calculate the MDE based on the desired level of statistical significance, power, and sample size, and ensure that the expected effect size is larger than the MDE in order to ensure that the A/B test is able to accurately detect the difference between the control and treatment groups.False Positives (Type I Errors) and False Negatives (Type II Errors)
When making decisions about an experiment, we can say that we made the right decision when choosing to ship a winning variation or shut down a losing variation. However, because there is always uncertainty in the world and we rely on statistics, sometimes we make mistakes. Generally, there are two kinds of errors we can make: Type I and Type II errors. Type I Errors: also known as False Positives, these are errors we make when we think the experiment provides us with a clear winner or a clear loser, but in reality the data are not clear enough to make this decision. For example, your metrics all appear to be winners, but in reality the experiment has no effect. Type II Errors: also known as False Negatives, these are errors we make when the data appear inconclusive, but in reality there is a winner or a loser. For example, you run an experiment for as long as you planned to, and the data aren’t showing a clear winner or loser when actually a variation is much better or worse. Type II errors often require you to collect more data or choose blindly rather than provide you with the correct, clear answer| Actual Results | ||||
| Inconclusive | Lost | Won | ||
| Decision Made | Inconclusive | Correct Inference | Type II error (false negative) | Type II error (false negative) |
| Shut down | Type I error (false positive) | Correct Inference | Type I error (false positive) | |
| Ship | Type I error (false positive) | Type I error (false positive) | Correct Inference |