

ProCUPED is available on Pro and Enterprise plans. EnterprisePost Stratification is available on Enterprise plans. CUPEDps (Controlled-experiment Using Pre-Experiment Data + post-stratification) increases the velocity of experimentation by reducing the uncertainty in estimates of experiment uplift. It uses both pre-experiment metric data as well as user attributes to improve the accuracy of experiment results.Documentation Index
Fetch the complete documentation index at: https://growthbook-preview.mintlify.app/llms.txt
Use this file to discover all available pages before exploring further.
Why use CUPEDps?
CUPEDps decreases the variance of experiment uplift, increasing the accuracy of your experimental results and therefore the speed at which you can see the effects of an experiment. In the right conditions, CUPEDps can equate to getting 20% or more traffic during your experiment!- In 2016, Netflix reported that CUPED reduced variance by roughly ~40% for some key engagement metrics (source).
- In 2022, Microsoft reported that, for one product team, CUPED was akin to adding 20% more traffic to analysis of a majority of metrics (source).
How does it work?
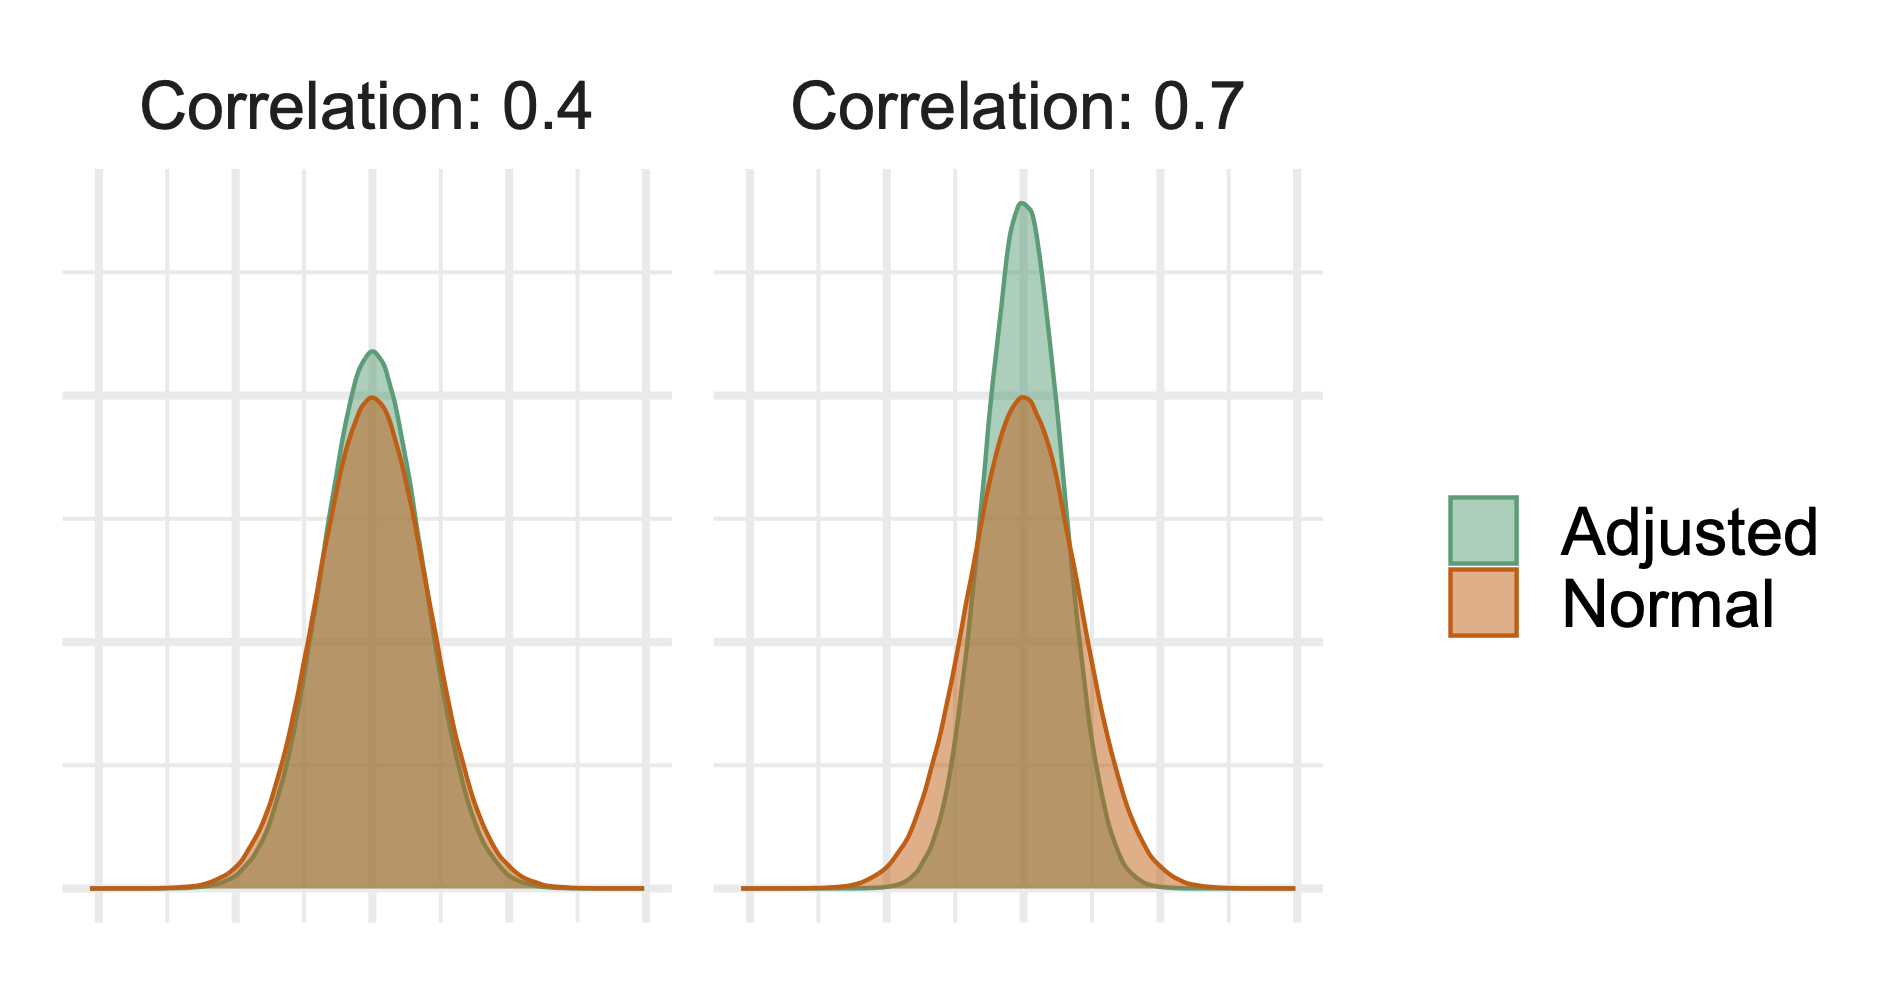
CUPEDps leverages both regression adjustment and post-stratification to improve the accuracy of your experiment results. Suppose revenue is your key metric, and you have historical revenue data on your users. You know that revenue spend varies across country (e.g. US vs. UK), and historical revenue spend is correlated with future revenue spend.In an ideal experiment, you would: 1) bucket users by country; 2) create pairs of users within each bucket that have the same revenue spend; and 3) randomly assign one user in each pair to the treatment and the other to the control. Balancing helps ensure the treatment and control groups are similar before the experiment starts, and makes it easier to detect post-randomization differences. However, this level of assignment in online experimentation is often difficult to achieve. CUPEDps is a statistical technique that permits you to answer the question, “If I had run the ideal experiment, what would the lift be?” Regression adjustment helps balance users with respect to their pre-randomization revenue spend. Post-stratification helps balance users by country and account for spending differences across countries. The more correlated the pre-experiment metric data and attributes are with your metric of interest, the more variance reduction you can achieve. For example, the following plot demonstrates the difference in the distribution of a metric before adjustment (“Normal”) and after adjustment (“Adjusted”). In both panels, the green, adjusted metric is distributed less widely (e.g. it is more tightly spaced out around the mean). However, the adjusted distribution is even tighter in the right plot, showing that variance reduction will be greater the more correlated your pre-experiment data is with your post-experiment data.
Why CUPEDps is different
We have combined CUPED with post-stratification to bring additional accuracy gains in three ways. Most importantly, we estimate average lift across all users by weighting the strata-specific (e.g. country-specific) lifts. Leveraging within-strata lifts isolates the treatment effect from the often substantial between-strata noise (e.g., the large natural differences in revenue between countries). This can significantly increase the precision of the overall lift estimate. For example, suppose average user revenue is high in the US and UK, but low in France. A two-sample t-test simply compares the averages of the two groups, ignoring strata information.In contrast, CUPEDps estimates are weighted averages of the lift for US users, the lift for UK users, and the lift for French users. Each of these three apples-to-apples comparisons are unaffected by the between-strata variability, and appropriately weighting them provides our lift estimate. Second, if there is an imbalance in the observed proportion of treatment users in a country compared to the variation split, then post-stratification will adjust the lift estimate for that country to account for the imbalance. For example, if the desired variation split for an experiment is 50/50, but within France it is 48/52, post-stratification will upweight the French control user metrics and downweight their treatment counterparts to reflect the true variation split. Finally, we can estimate country-specific lifts by running CUPED for each country individually. This can lead to additional variance reduction when the country-specific relationships in pre-experiment and post-exposure metric behavior vary. You can read more technical details about when post-stratification is useful and how, with large enough data, it is often as good as stratifying your experiment ahead of time (see section 3.4 in Xie and Aurisset 2016).
Configuring CUPEDps
Organization-level settings
You can turn CUPEDps on for all analyses under Settings → General. CUPEDps can be turned on or off by default for all analyses and you can set the default number of days to use for a lookback window. This setting will set the default for all of your metrics, which will then flow through to all analyses that use those metrics.
Metric-level settings
You can also override these organization-level defaults at the Metric level. When creating or editing a Metric, go to the “Behavior” panel, click “Show advanced options” and scroll to the bottom. From there, you will see the following settings. These settings will allow you to disable CUPED for a metric, even if it is set at the organization or experiment level.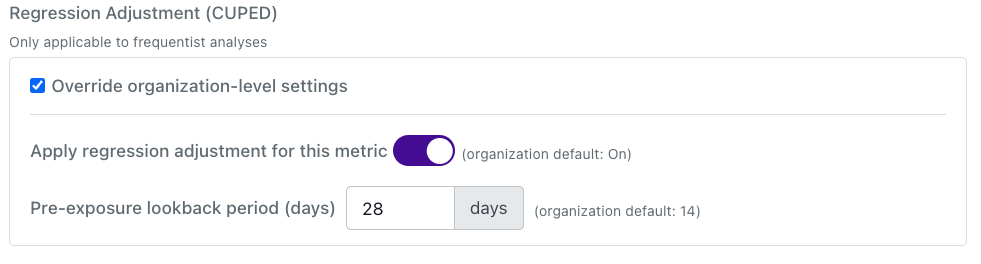
Experiment settings and results
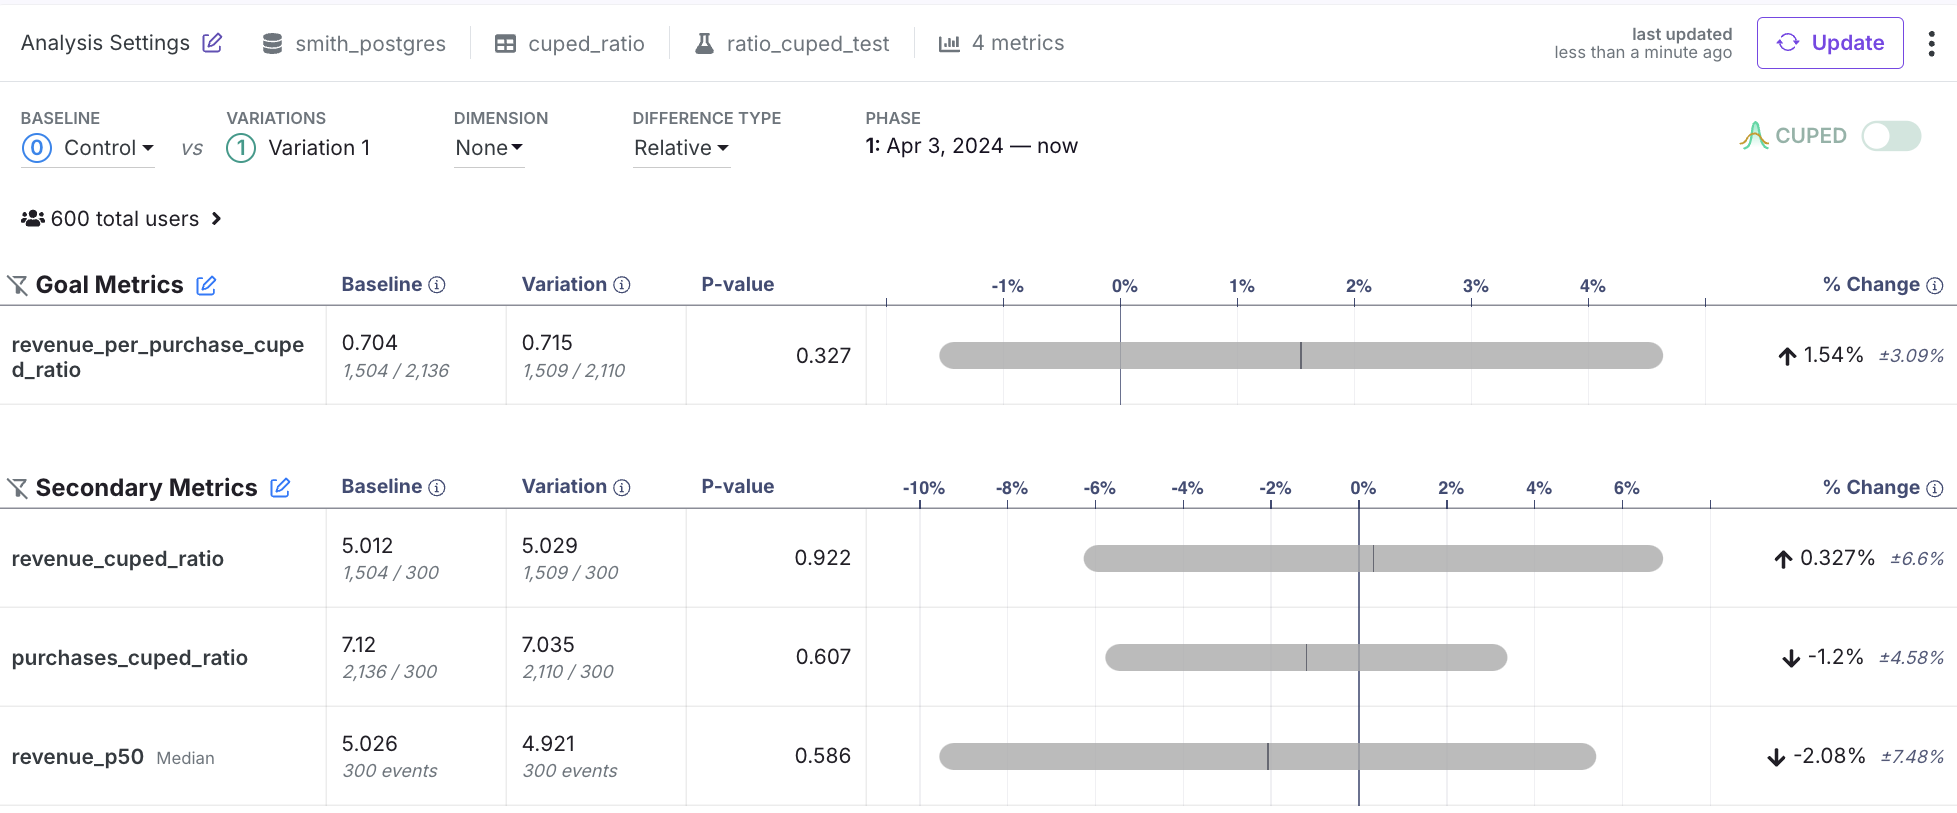
By default, each experiment will use your organization-level defaults, unless they are overridden by a metric. However, you can always toggle CUPED on or off using the toggle added to the top of the results table. You need to re-run your analysis if you change this setting. If the toggle is On, then CUPEDps will be applied for all metrics, excluding the cases described above (e.g., legacy ratio metrics) and exceptions like metric overrides. The following screenshot shows the results with CUPEDps on. However, you can see that there is an icon showing that CUPEDps is disabled for revenue_p50 (because it is a quantile metric). So even if CUPEDps is toggled on, we will always show you any metrics for which GrowthBook did not use CUPEDps using that small CUPEDps icon with a red x.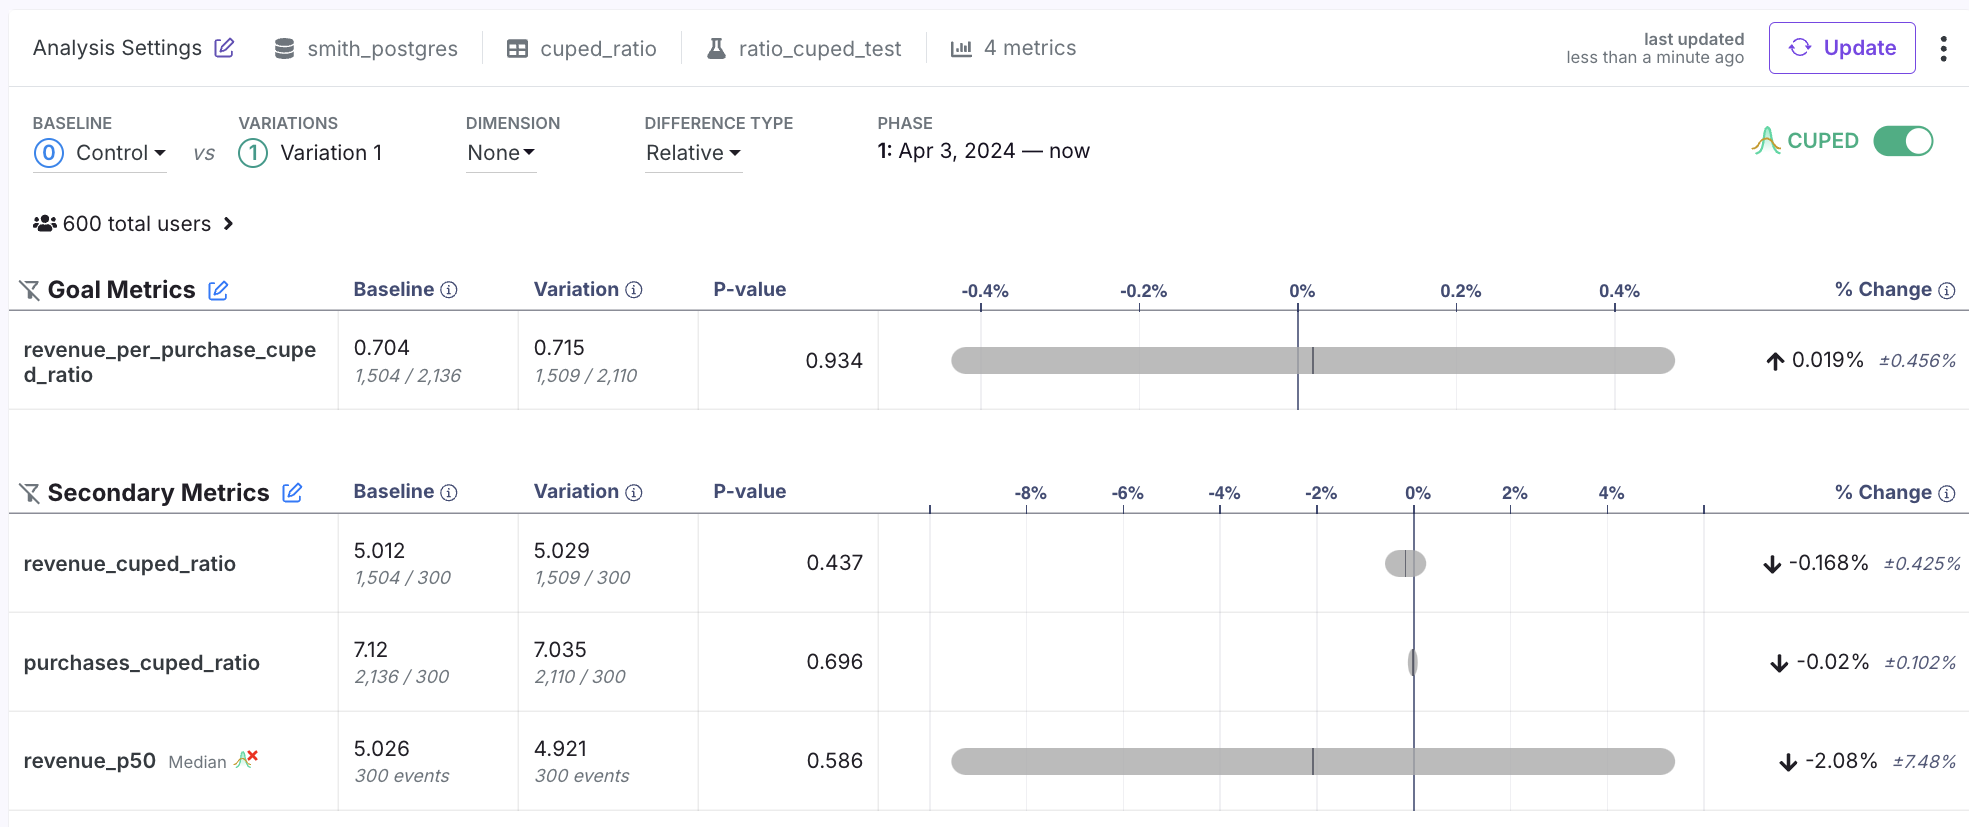
Regression Adjustment lookback window
GrowthBook defaults to using 14 days of pre-exposure data, but this is customizable at the organization, metric, and metric-experiment level. Why use a longer lookback window?- A longer window can be better if your metric is low frequency and a longer window is needed to capture meaningful user behavior that will be correlated across the pre- and post-exposure time periods
- Shorter lookback windows will yield more performant queries (fewer days to scan from your metric source)
- Behavior in the days just before a user enters an experiment is likely to be more highly correlated with behavior during an experiment, as users change over time. Of course, this is mostly true for metrics that are observed at a higher frequency (e.g. simple engagement metrics).
Availability
CUPEDps works for all metrics except for:- Ratio metrics that are the goal metric for a Bandit
- Quantile metrics
- Legacy (non-fact) ratio metrics
- Legacy (non-fact)metrics with custom user value aggregations
- Metrics from a MixPanel data sources